

Breaking it down: Understanding the four types of flood risk in Auckland
Not all "flood zones" are created equal. In Auckland, the maps you see on Relab or Auckland Council's Flood Viewer are built from several different layers – each describing a different type of flood risk and behaviour in a storm.
Since the January 2023 floods and Auckland Council's Plan Change 120 (PC120) work on housing intensification and natural hazards, these layers are no longer just background noise. They feed into a new risk-based planning framework that is used to assess where development is acceptable, and where it isn't.
In this article we'll break down, in plain language:
- What AEP and ARI actually mean
- The four key flood layers used in Auckland
- How they relate to your property and to PC120
- How Relab's flood hazard map layer helps you see them faster
A quick refresher: AEP and ARI
Before we talk about map layers, it's worth revisiting two bits of jargon you'll see in council documents and engineering reports:
- AEP (Annual Exceedance Probability) – the chance of a given flood size happening in any one year. A "1% AEP" event means there is a 1 in 100 chance of that flood size being reached or exceeded in any given year.
- ARI (Average Recurrence Interval) – the long-term average time between events of a certain size. A 100-year ARI event doesn't happen "once every 100 years"; it means that, in the long run, those events average out to about one every 100 years.
In practice, both terms are different ways of describing how rare and how big an event is. The important point: a "1% AEP" flood is not impossible – it's a realistic design event that can happen more than once in your lifetime.
Where PC120 fits into flood risk
PC120 is Auckland Council's proposed plan change that, among other things, tightens how natural hazards are managed in the Unitary Plan:
- It introduces a risk-based framework for natural hazards like flooding, where risk is described as Significant, Potentially tolerable or Acceptable.
- It updates how hazard areas are identified and mapped, using more recent information on flooding, climate change and sea level rise.
- It signals that land at the greatest risk of flooding should have zoning that minimises exposure to that risk, so that future development doesn't put more people and property in harm's way.
The four flood map layers below are part of that picture – they are key inputs into how risk is understood for a given site.
The four main flood map layers in Auckland
1. Floodplains – where rivers and streams spill out
What they are
Floodplains show the areas that are predicted to be underwater in a 1% AEP flood, including allowances for climate change and (in many models) expected development. In simple terms: if a major event hits, this is where water is expected to spread out of rivers, streams and major overland flow paths.
What it means for a property
If part of your site falls inside a mapped floodplain:
- The property is exposed to deeper, more sustained flooding in big events.
- Any new buildings or major changes are likely to face stricter consent tests and may need formal flood risk assessments.
- Under PC120's framework, this is the kind of area that might be treated as having higher flood risk, which feeds into how council approaches zoning and consents.
Floodplains are often the most important layer for planning and insurance conversations.
2. Flood prone areas – local bathtubs and low points
What they are
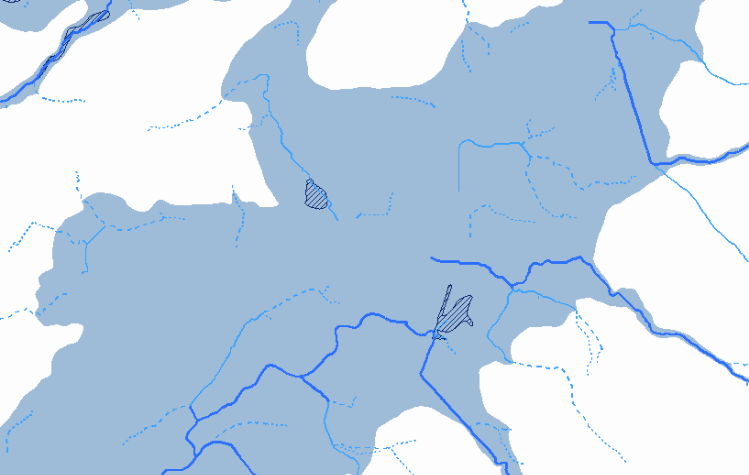
Flood prone areas are local depressions in the ground where water can pond because there's nowhere for it to drain easily. Think of them as "bathtubs" in the landscape – basements, backyards or corners of sections where water tends to sit.
What it means for a property
- They're often shallow but annoying – think ponding on lawns, driveways or garages.
- The depth and duration of ponding matter – shallow, short-lived ponding is very different to deep water that reaches floor levels.
- Under the risk framework, their impact on overall risk depends on how deep, how fast, and how often they flood, and what sits in those low points (house, access, services etc.).
On their own, flood prone areas are not always a deal-breaker – but they're a strong signal to check levels, floor heights and drainage carefully.

3. Overland flow paths – stormwater's natural shortcuts
What they are
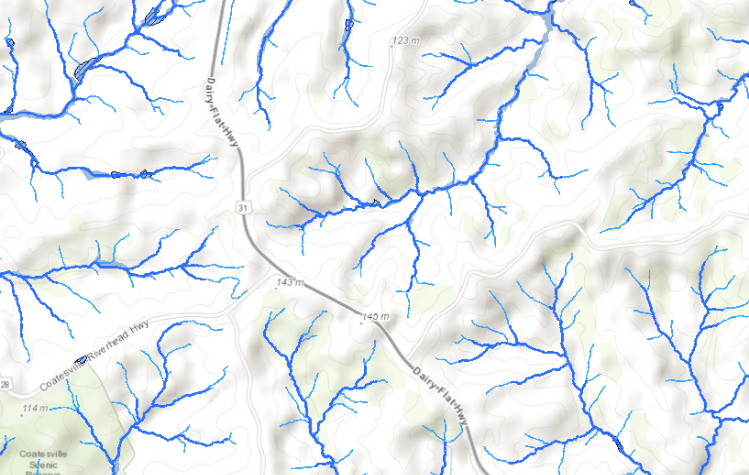
Overland flow paths show where stormwater will naturally run over land when pipes and gutters are full or blocked. These are often aligned with natural gullies, driveways and low strips between houses.
Important detail
Council models these paths based mainly on topography – where gravity will take the water. That means fences, walls and buildings can change the exact route, but the general direction and volume of flow give you a good idea of what's at risk.
What it means for a property
- Minor overland flow at the edge of a large section may be manageable.
- A major overland flow path running through your likely building platform, driveway or garage is a serious concern.
- Under PC120 and the updated Natural Hazards policies, there is a strong focus on maintaining overland flow paths so that they can keep doing their job in big events, rather than being blocked and redirecting water in dangerous ways.
For development, this often means leaving key flow paths clear, and designing buildings and site levels around them.
4. Coastal inundation – storm surge and sea level rise
What it is
Coastal inundation layers map areas of low-lying coastal land that are at risk from storm surge and, over time, sea level rise. In these areas, the hazard can come from the sea or estuary, rather than rainfall alone.
What it means for a property
- These sites can face a double hit: more frequent flooding over time and increasing insurance and finance pressure.
- Long-term, some coastal properties may see tighter council controls or changing expectations around what kind of development is appropriate.
Coastal inundation is not always shown in the same way in every tool – for detailed coastal checks, it's best to cross-check Flood Viewer and GeoMaps, and to review the property's LIM and property file.
How Relab helps you see all this faster
Council's tools are excellent, but they can be slow and fiddly – especially if you're checking multiple properties.
Relab brings the key flood layers into your everyday workflow:
- A flood hazard map layer that lets you see floodplains, flood prone areas and overland flow paths on top of parcel boundaries and other property data.
- Services and contours overlays so you can check stormwater/wastewater lines and natural drainage patternswithout leaving the platform.
- Property search and mapping tools that let you move quickly between sites when you're comparing options.
Used together with Auckland Council's Flood Viewer, GeoMaps and the PC120 map viewer, Relab gives you a fast first pass on flood risk, so you know which sites are worth a deeper look.
What this means for owners, buyers and agents
For owners and buyers:
- You can quickly see which layers affect your property, instead of guessing what "flood zone" might mean.
- You can decide when to dig deeper (LIM, property file, engineers) and when the risk looks low.
- You're better equipped to talk to insurers, banks and council in informed terms.
For agents:
- You can arrive at appraisals already knowing how floodplains, flood prone areas and overland flow paths affect the property.
- You can build trust with vendors and buyers by explaining the maps clearly and showing the steps you've taken to understand risk.
- You can position yourself as someone who understands the PC120 context, not just surface-level marketing.
Wrapping up
Auckland's flood maps can look confusing at first glance, but once you understand the four main layers, the picture gets much clearer.
- Floodplains – big-event spill areas from rivers/streams
- Flood prone areas – local ponding in low spots
- Overland flow paths – stormwater's natural routes over land
- Coastal inundation – low-lying coastal risk from sea and estuary
PC120 adds another layer to this story by using these maps inside a risk-based framework for natural hazards. Flood risk now matters not just for insurance and resale, but also for what council will, or won't, support on a site.
Use Relab as your first-pass tool to see these layers quickly, then back it up with Council's Flood Viewer, GeoMaps, PC120 map viewer and professional advice where needed.
Important: This article summarises Auckland flood map layers and PC120 natural hazard context in general terms. It is general information only and is not planning, legal, engineering or insurance advice.
PC120 is still progressing through the formal plan change process. Before making decisions about buying, selling or developing, always:
- Check the latest Auckland Council Flood Viewer, GeoMaps, PC120 map viewer and planning maps
- Review the property's LIM and property file, and
- Get advice from a suitably qualified planner, engineer and/or legal professional for your specific situation.